Operations Center
Run the platform, not just the campaigns
Service health, dialer status, agents, tenants and every live call in one place. Trace a single call end to end, tune AMD against real decisions, and keep an audit of every remediation action taken.
14-day free trial · no credit card required
Quick answer
What you get
Everything in one workspace
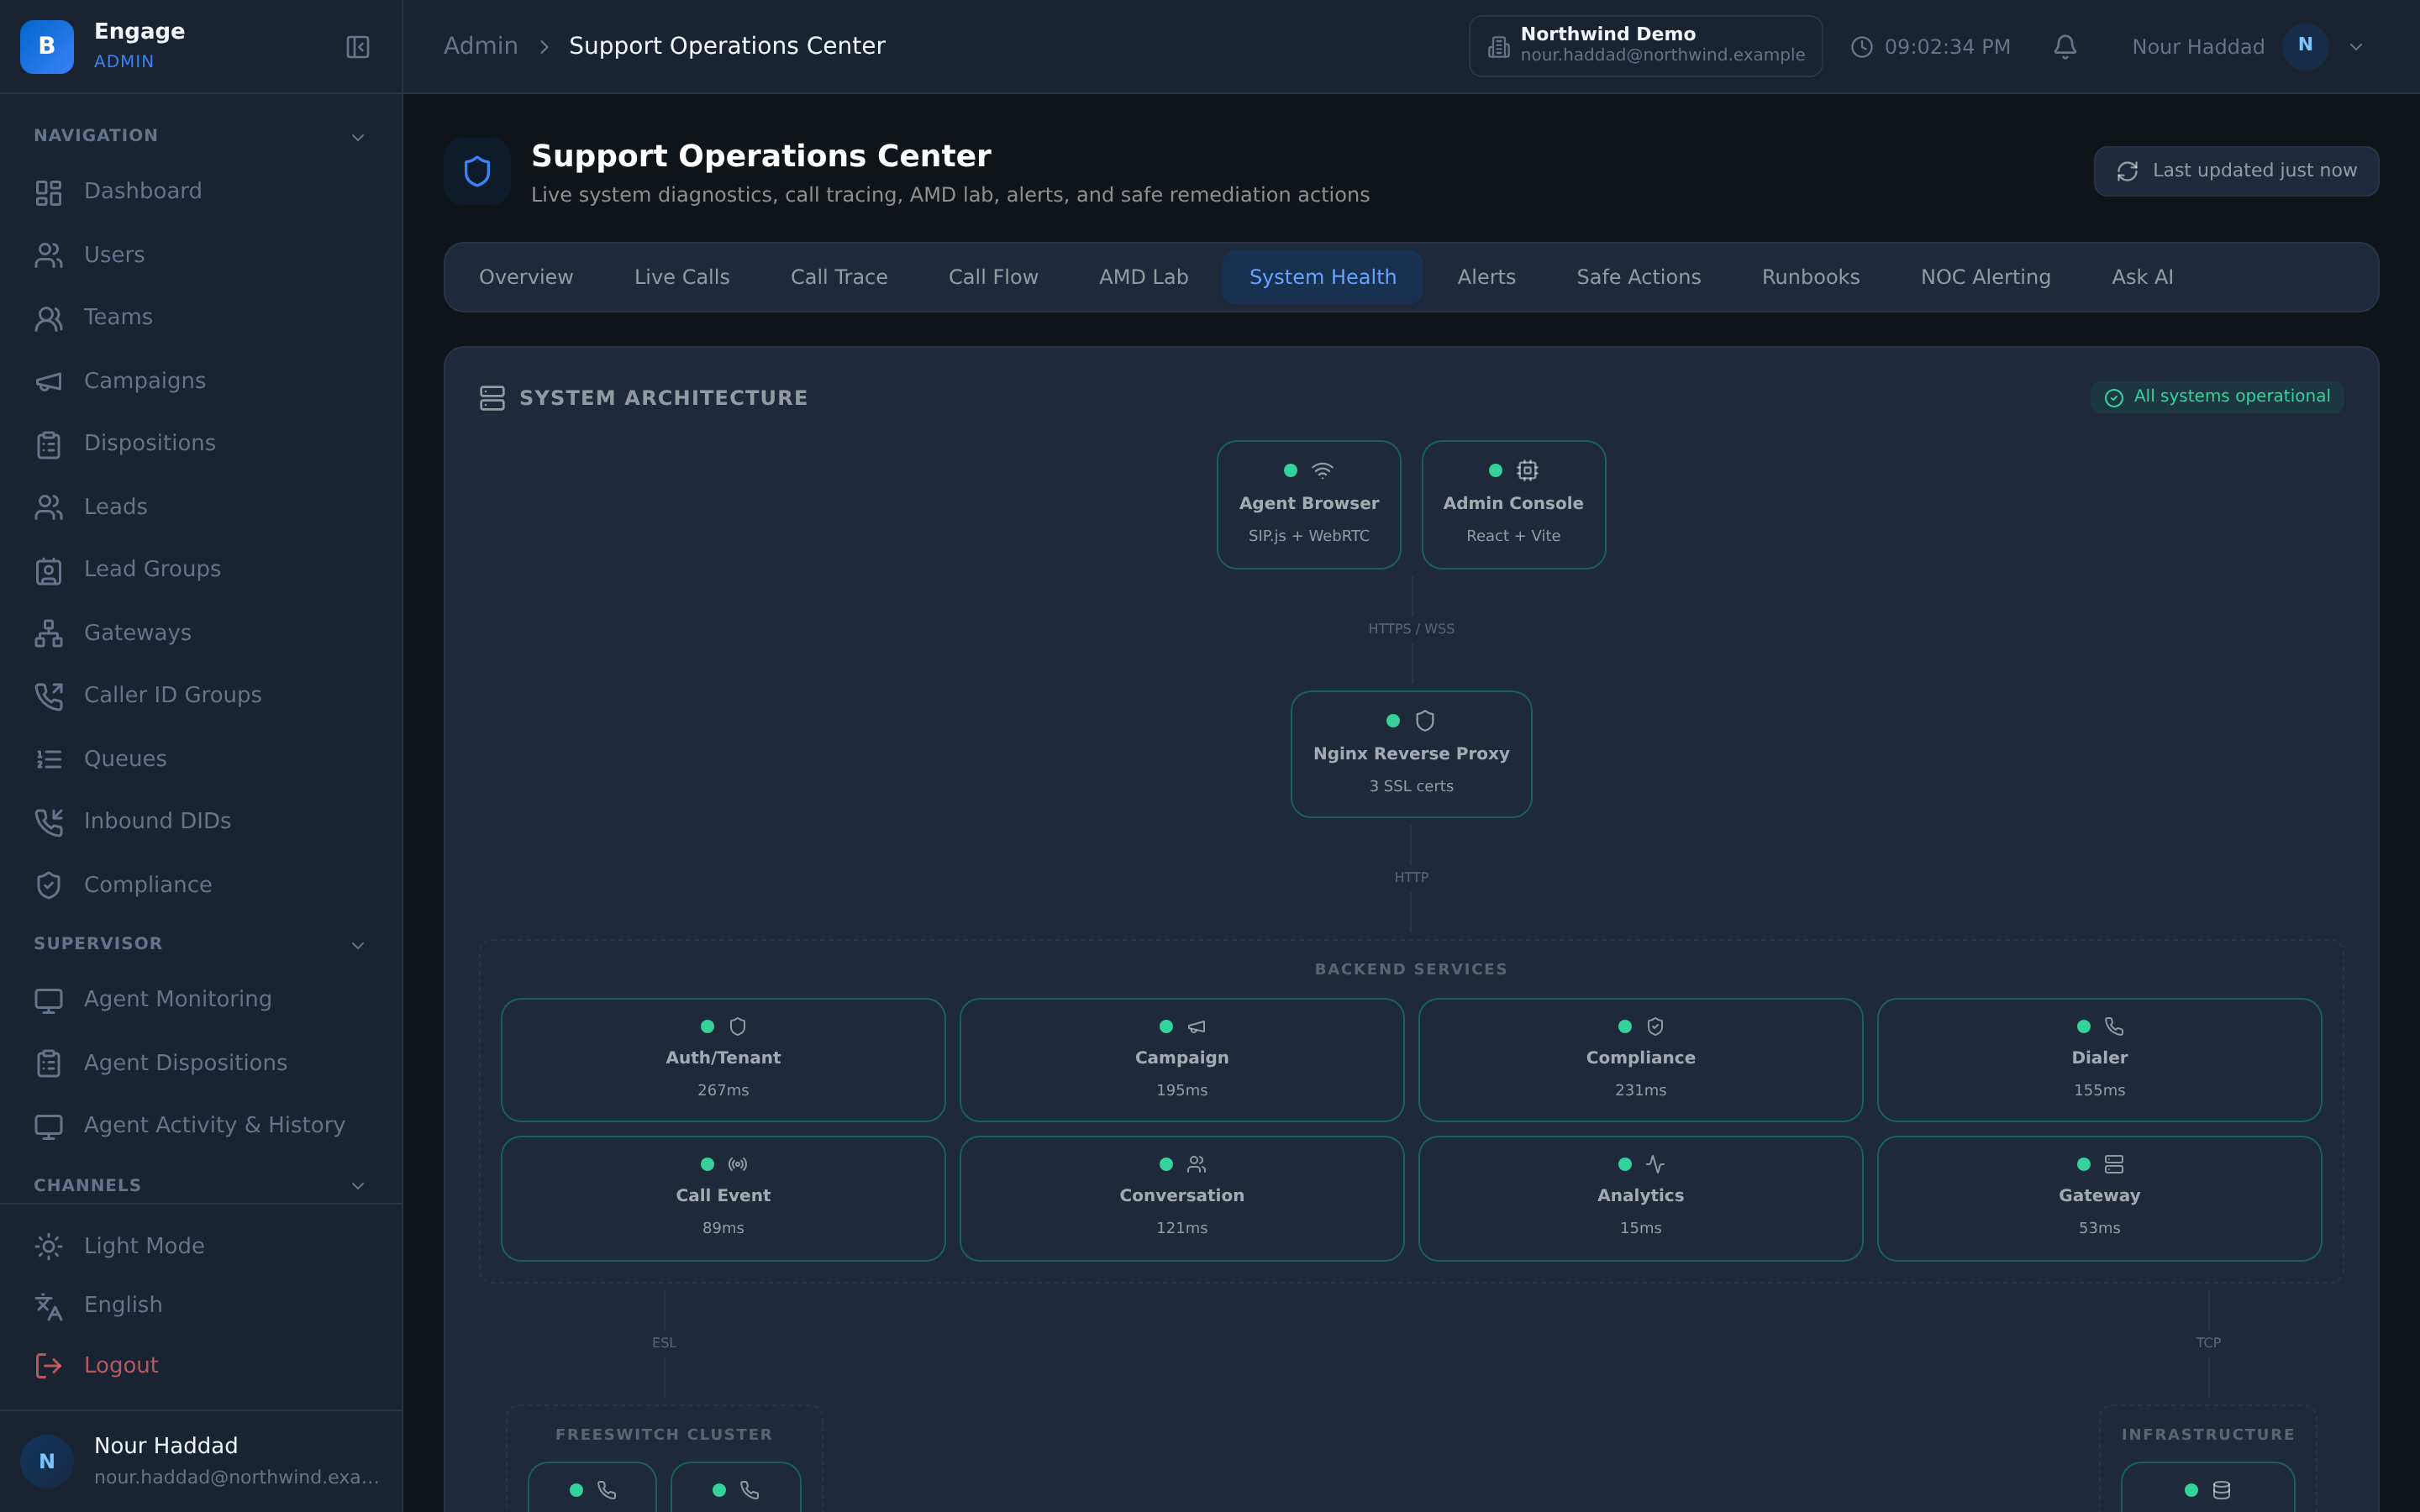
Ops summary and service health
One summary across the platform services, each with its own health state, so you find the failing part before a customer tells you which one it was.
Dialer status
What the dialer is doing right now, as its own status rather than something you infer from call volume.
Agents and tenants
Agent and tenant views across the platform, so an operator running many tenants sees the whole estate in one place.
Live calls
Every call in progress across the platform, listed while it is still up.
Call trace
Trace one call end to end by its identifier. The answer to what happened on that call, rather than a theory about it.
Alerts with NOC configuration
Alerts you configure for a NOC, with snooze so a known issue stops shouting, and a history so you can see what fired and when.
Remediation with an audit trail
Remediation actions are recorded in an audit. What was done to the platform, by whom, is a record and not a memory.
Ask AI over platform state
Ask a question about the current state of the platform in plain language and get an answer from the state itself.
Coaching rules
Rules that drive coaching on the floor, configured centrally alongside everything else.
AMD overview and rollback
An AMD overview with recent decisions, labelling, patterns and rollback, so machine detection is something you tune with evidence rather than guess at.
Call quality and MOS
Mean opinion score is captured per call, and low-MOS alerts surface on the wallboard while the shift is running.
Reapers and reconcilers
Orphan and stuck-call reapers, in-flight reconcilers and dependency-aware readiness. The cleanup that stops a wedged call from holding a seat all afternoon.
Live calls
Every call in progress, while it is still in progress
The live-call view lists what is up across the platform right now, next to the agent and tenant views and the dialer status. It is the screen you open when someone says the platform feels slow.
Because it is platform-wide, a partner administrator running many tenants sees the whole estate rather than logging into each one in turn. Tenant administrators see their own tenant only.
- Live calls across the platform, listed as they run
- Dialer status, agent view and tenant view beside them
- Ops summary with a health state per service
- Available to platform and partner administrators; tenant admins see their own tenant
Call trace
One call, traced end to end
Arguments about a call end when you trace it. Call trace takes a single call and shows what the platform did with it, step by step, across the services it touched.
Beside it sits call quality. Mean opinion score is captured per call, so a trace is not only a sequence of events, it also tells you whether the audio was any good. Low-MOS alerts surface on the wallboard so the floor sees a quality problem in the shift it happened in.
- Trace a single call by its identifier, across services
- MOS captured per call, so audio quality sits with the call record
- Low-MOS alerts surface on the wallboard
- AMD overview with recent decisions, labelling, patterns and rollback
Alerts and remediation
An alert, then a record of what you did about it
Alerts are configured for a NOC, can be snoozed when the issue is known, and keep a history so you can see what fired and when. That is the ordinary half.
The half that matters at audit time is remediation. When someone acts on the platform, the action is recorded in an audit. Six months later the question is never what alerted, it is who changed what, and this is where that answer lives.
- Alerts with NOC configuration, snooze and history
- Remediation actions recorded in an audit
- Ask AI over platform state, in plain language
- Coaching rules configured alongside the alerting
How it compares
| A status page | The DialerBee operations center | |
|---|---|---|
| What it shows | Green or red per service | Ops summary and health, dialer status, agents, tenants and live calls |
| A single bad call | Nothing | Call trace end to end, with the MOS captured for that call |
| Alerting | An email when something breaks | NOC-configured alerts with snooze and history |
| After the fix | Nothing recorded | Remediation actions recorded in an audit |
| Machine detection | A setting you change and hope | AMD overview with recent decisions, labelling, patterns and rollback |
| Cleanup | Manual, when someone notices | Orphan and stuck-call reapers, in-flight reconcilers, dependency-aware readiness |
Frequently asked questions
What is Operations Center in DialerBee?+
It is the platform-operations view. It carries an ops summary with health across the services, dialer status, agent and tenant views, live calls, and call trace for a single call. Alerts are configured for a NOC with snooze and history, and remediation actions are recorded in an audit.
Who can see the operations center?+
It is available to platform and partner administrators. Tenant administrators see their own tenant. A partner running many tenants sees the estate they own rather than everything on the platform.
Can I trace what happened on one specific call?+
Yes. Call trace takes a single call and shows what the platform did with it across the services it touched. The mean opinion score captured for that call sits alongside, so you can tell an audio problem from a routing problem.
How does DialerBee handle call quality?+
MOS is captured per call. Low-MOS alerts surface on the wallboard, which puts an audio problem in front of the floor during the shift rather than in a report the next day.
What happens when an alert fires?+
Alerts are configured for a NOC and carry snooze and a history, so a known issue can be quietened without being forgotten. Any remediation action taken is recorded in an audit, so the record of what was changed survives the incident.
What is the AMD section for?+
It gives an AMD overview with recent decisions, labelling, patterns and rollback. Answering-machine detection is tuned against real decisions you can label, and a change can be rolled back if it makes things worse.
What runs underneath the platform?+
Two FreeSWITCH media nodes with client failover, gateway sync to every node, orphan and stuck-call reapers, in-flight reconcilers and dependency-aware readiness checks. The reapers and reconcilers are what stop a wedged call from holding a seat.
Can I just ask what is going on?+
There is an Ask AI function over platform state, so you can put a question about the current state in plain language and get an answer from the state itself rather than assembling it from screens.
See the operations center on a demo platform
A 30-minute walkthrough on a demo tenant, in English or Arabic.