Reports and Insights
Fifteen reports, and the events underneath them
Campaign, agent, call, queue, cost, quality, compliance and conversion reporting, exportable as CSV, Excel or a branded PDF. An Insights centre with four tabs, a wallboard the floor can see, and agent activity detailed down to individual disposition events.
14-day free trial · no credit card required
Quick answer
What you get
Everything in one workspace
15 report types
Fifteen named reports covering campaigns, agents, calls, queues, cost, quality, compliance and conversion. Every one of them is listed on this page, so you can check before you buy.
CSV, Excel and PDF export
Export any report as CSV, as Excel or as a PDF carrying your tenant branding. The PDF is the one you send to a client; the CSV is the one you load somewhere else.
Arabic that survives the export
Disposition reports export to Excel and PDF with Arabic rendered correctly. Right-to-left text that arrives as boxes is not a report, and most tools get this wrong.
Insights centre
Four tabs over the same data: Call Outcomes, Service Level, Dispositions and AMD. Built for the question you are actually asking rather than one wall of charts.
Wallboard
Live KPIs on the screen the floor can see, with an agent state grid beside them so you know who is on what right now.
Leaderboard
A ranked view of the floor, driven by the same numbers the reports use, so nobody argues with the board.
MOS card
Call quality on the wallboard as a mean opinion score card, so a bad-audio day shows up as a number instead of a rumour.
Agent activity and live timers
Activity history per agent plus live timers on the current state, so you can see both what someone is doing and what they have been doing.
Per-agent disposition events
Every disposition an agent set, as an event with a time on it. The audit trail behind an agent performance number.
AI call results
Each AI call with its recording, its transcript and an export, so an AI conversation is reviewable the same way a human one is.
AI usage and billing
What the AI agents consumed and what it cost, per tenant. The number you need before you resell it.
Utilisation, not scheduling
Agent activity and utilisation reports today; forecasting and scheduling are planned. Said plainly so you can plan around it.
The full list
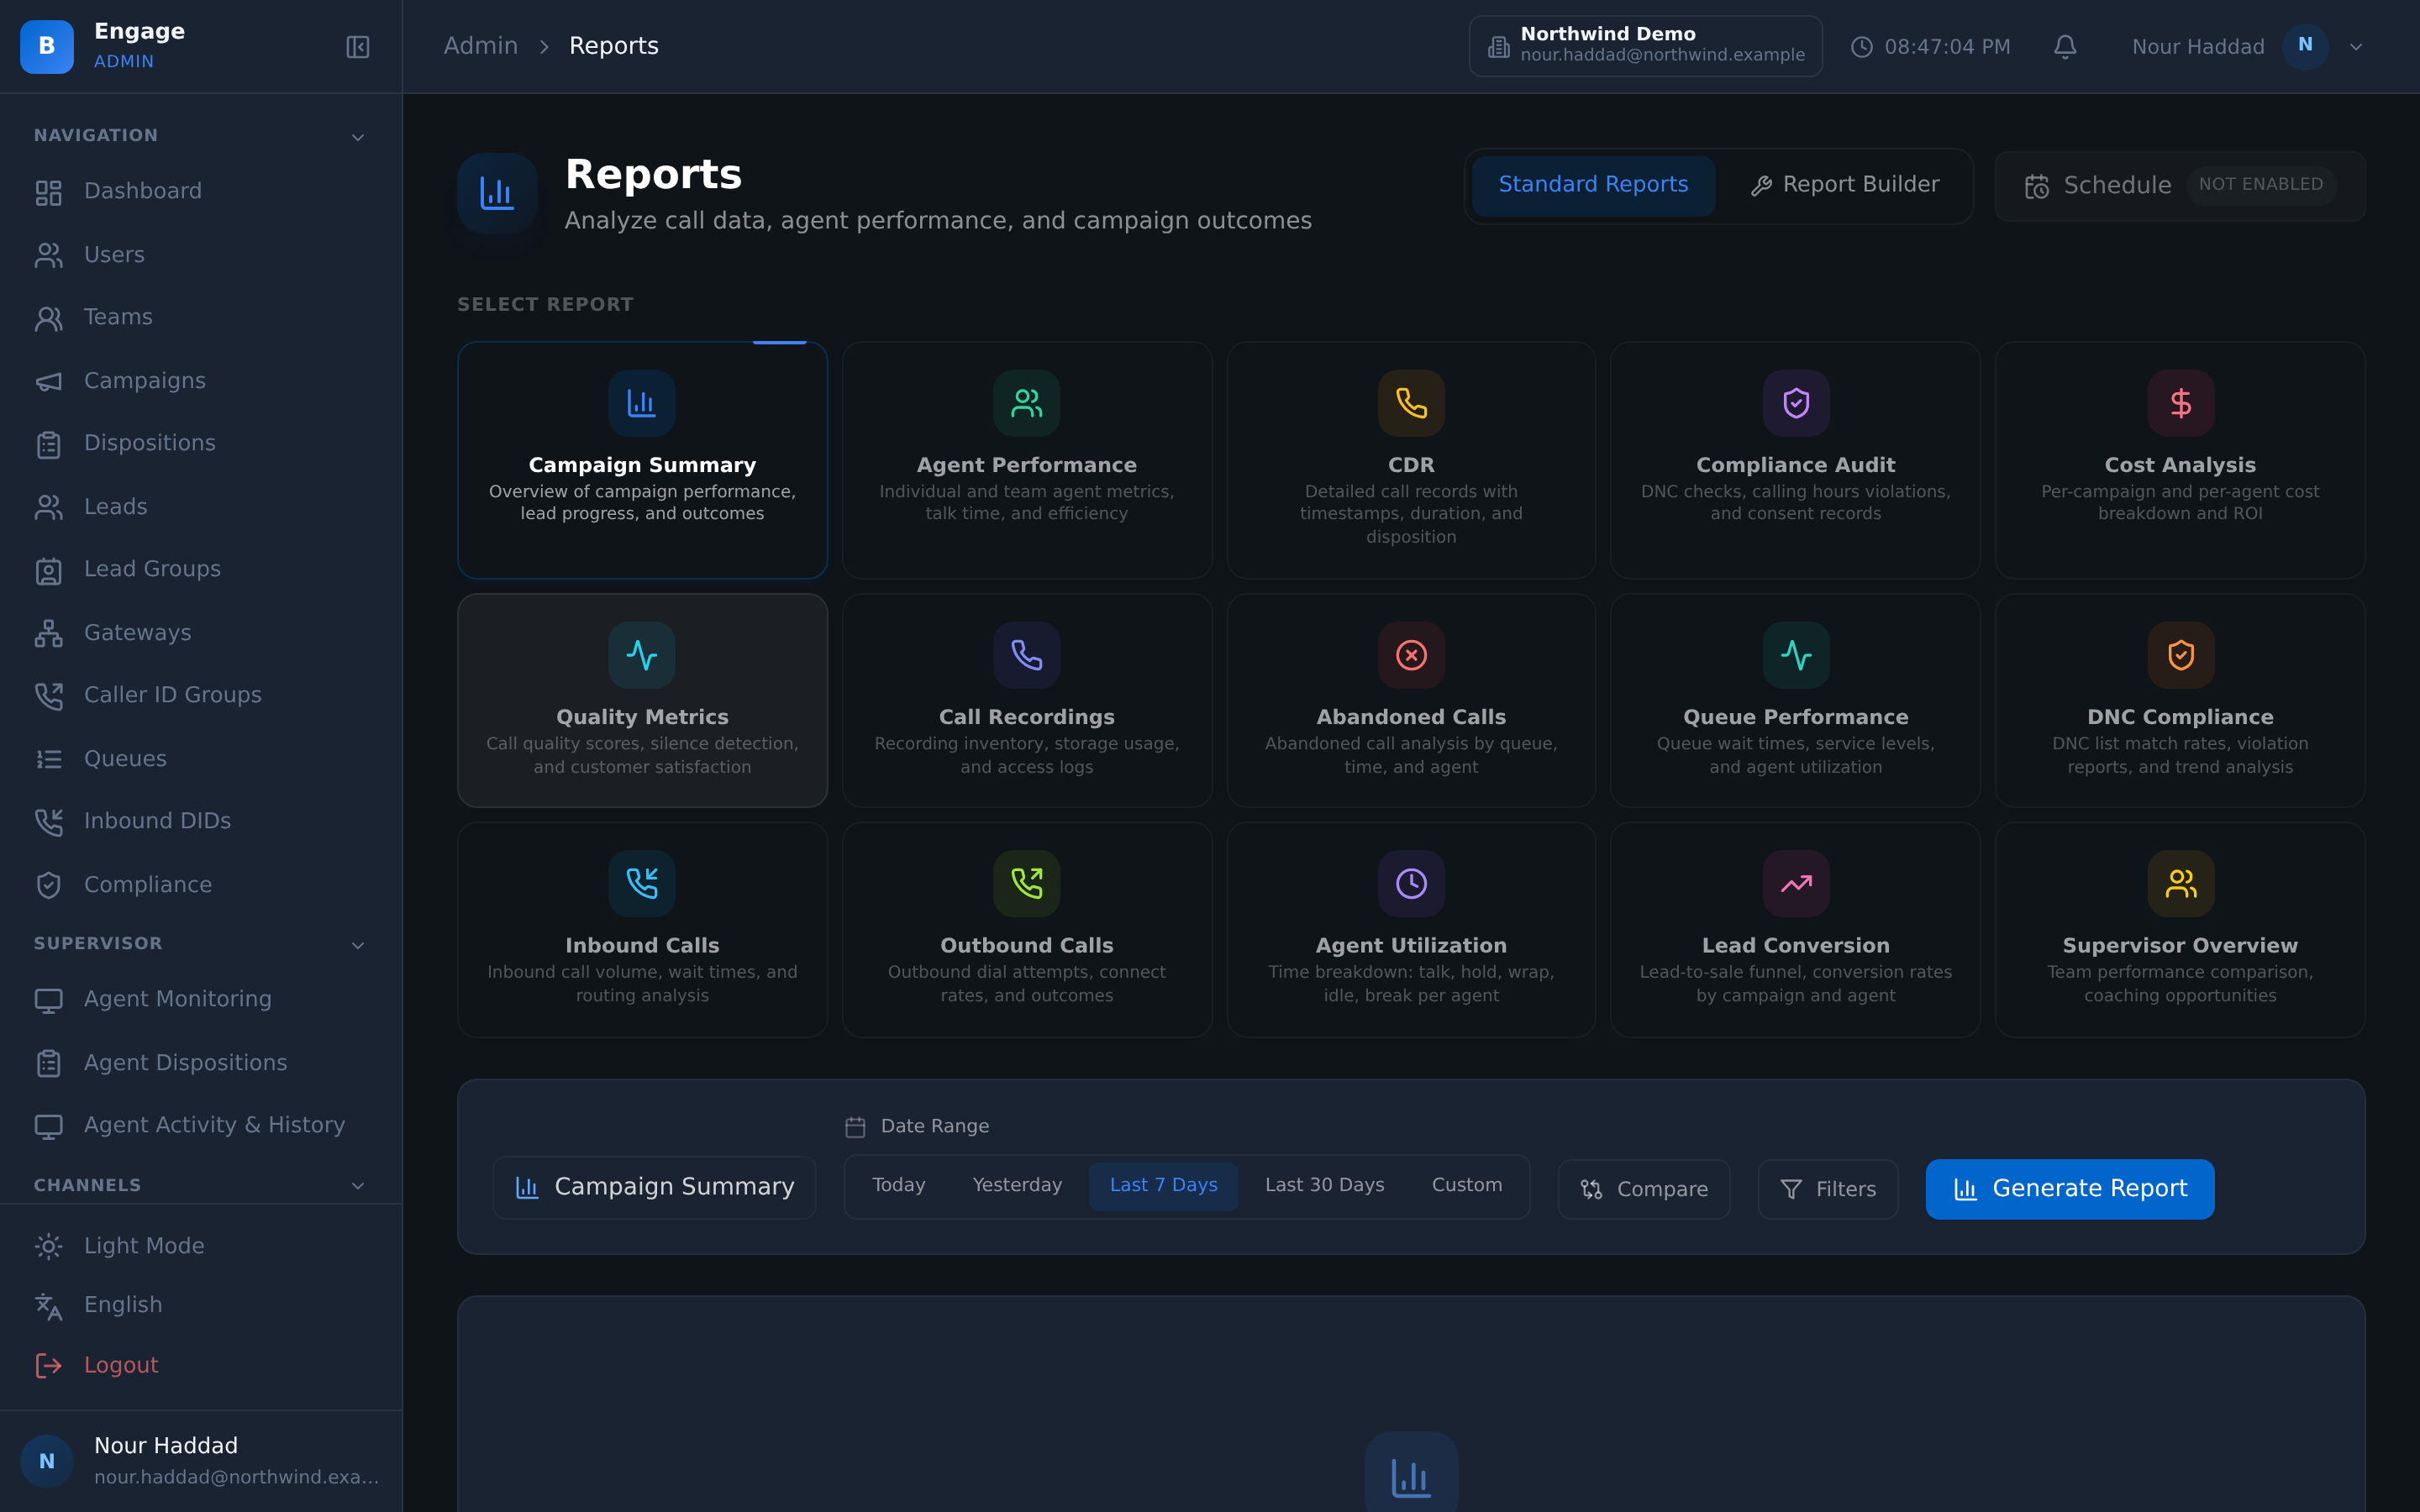
All 15 report types
Named, so you can check them against what you report on today before you move anything.
-
01
Campaign Summary
How a campaign performed end to end: dialled, connected, dispositioned.
-
02
Agent Performance
Talk time, wrap time, outcomes and volume per agent.
-
03
CDR
The call detail record, row by row, for billing and for arguments about what happened.
-
04
Compliance Audit
What was called, when, under which consent and which calling window.
-
05
Cost Analysis
Spend by campaign, by destination and by trunk.
-
06
Quality Metrics
Scorecard results and the quality picture behind them.
-
07
Call Recordings
The recording inventory with the calls it belongs to.
-
08
Abandoned Calls
Calls dropped before an agent arrived, with the reason.
-
09
Queue Performance
Wait time, service level and answer behaviour per queue.
-
10
DNC Compliance
Do-not-call scrubbing and suppression, evidenced.
-
11
Inbound Calls
The inbound side on its own: volume, handling and outcome.
-
12
Outbound Calls
The outbound side on its own, campaign by campaign.
-
13
Agent Utilization
How much of a paid hour was spent on productive states.
-
14
Lead Conversion
What a list turned into, from load to closed outcome.
-
15
Supervisor Overview
The floor in one report, for the person answering for it.
Every report exports as CSV, Excel or a PDF carrying your tenant branding.
Insights centre
Four tabs, four different questions
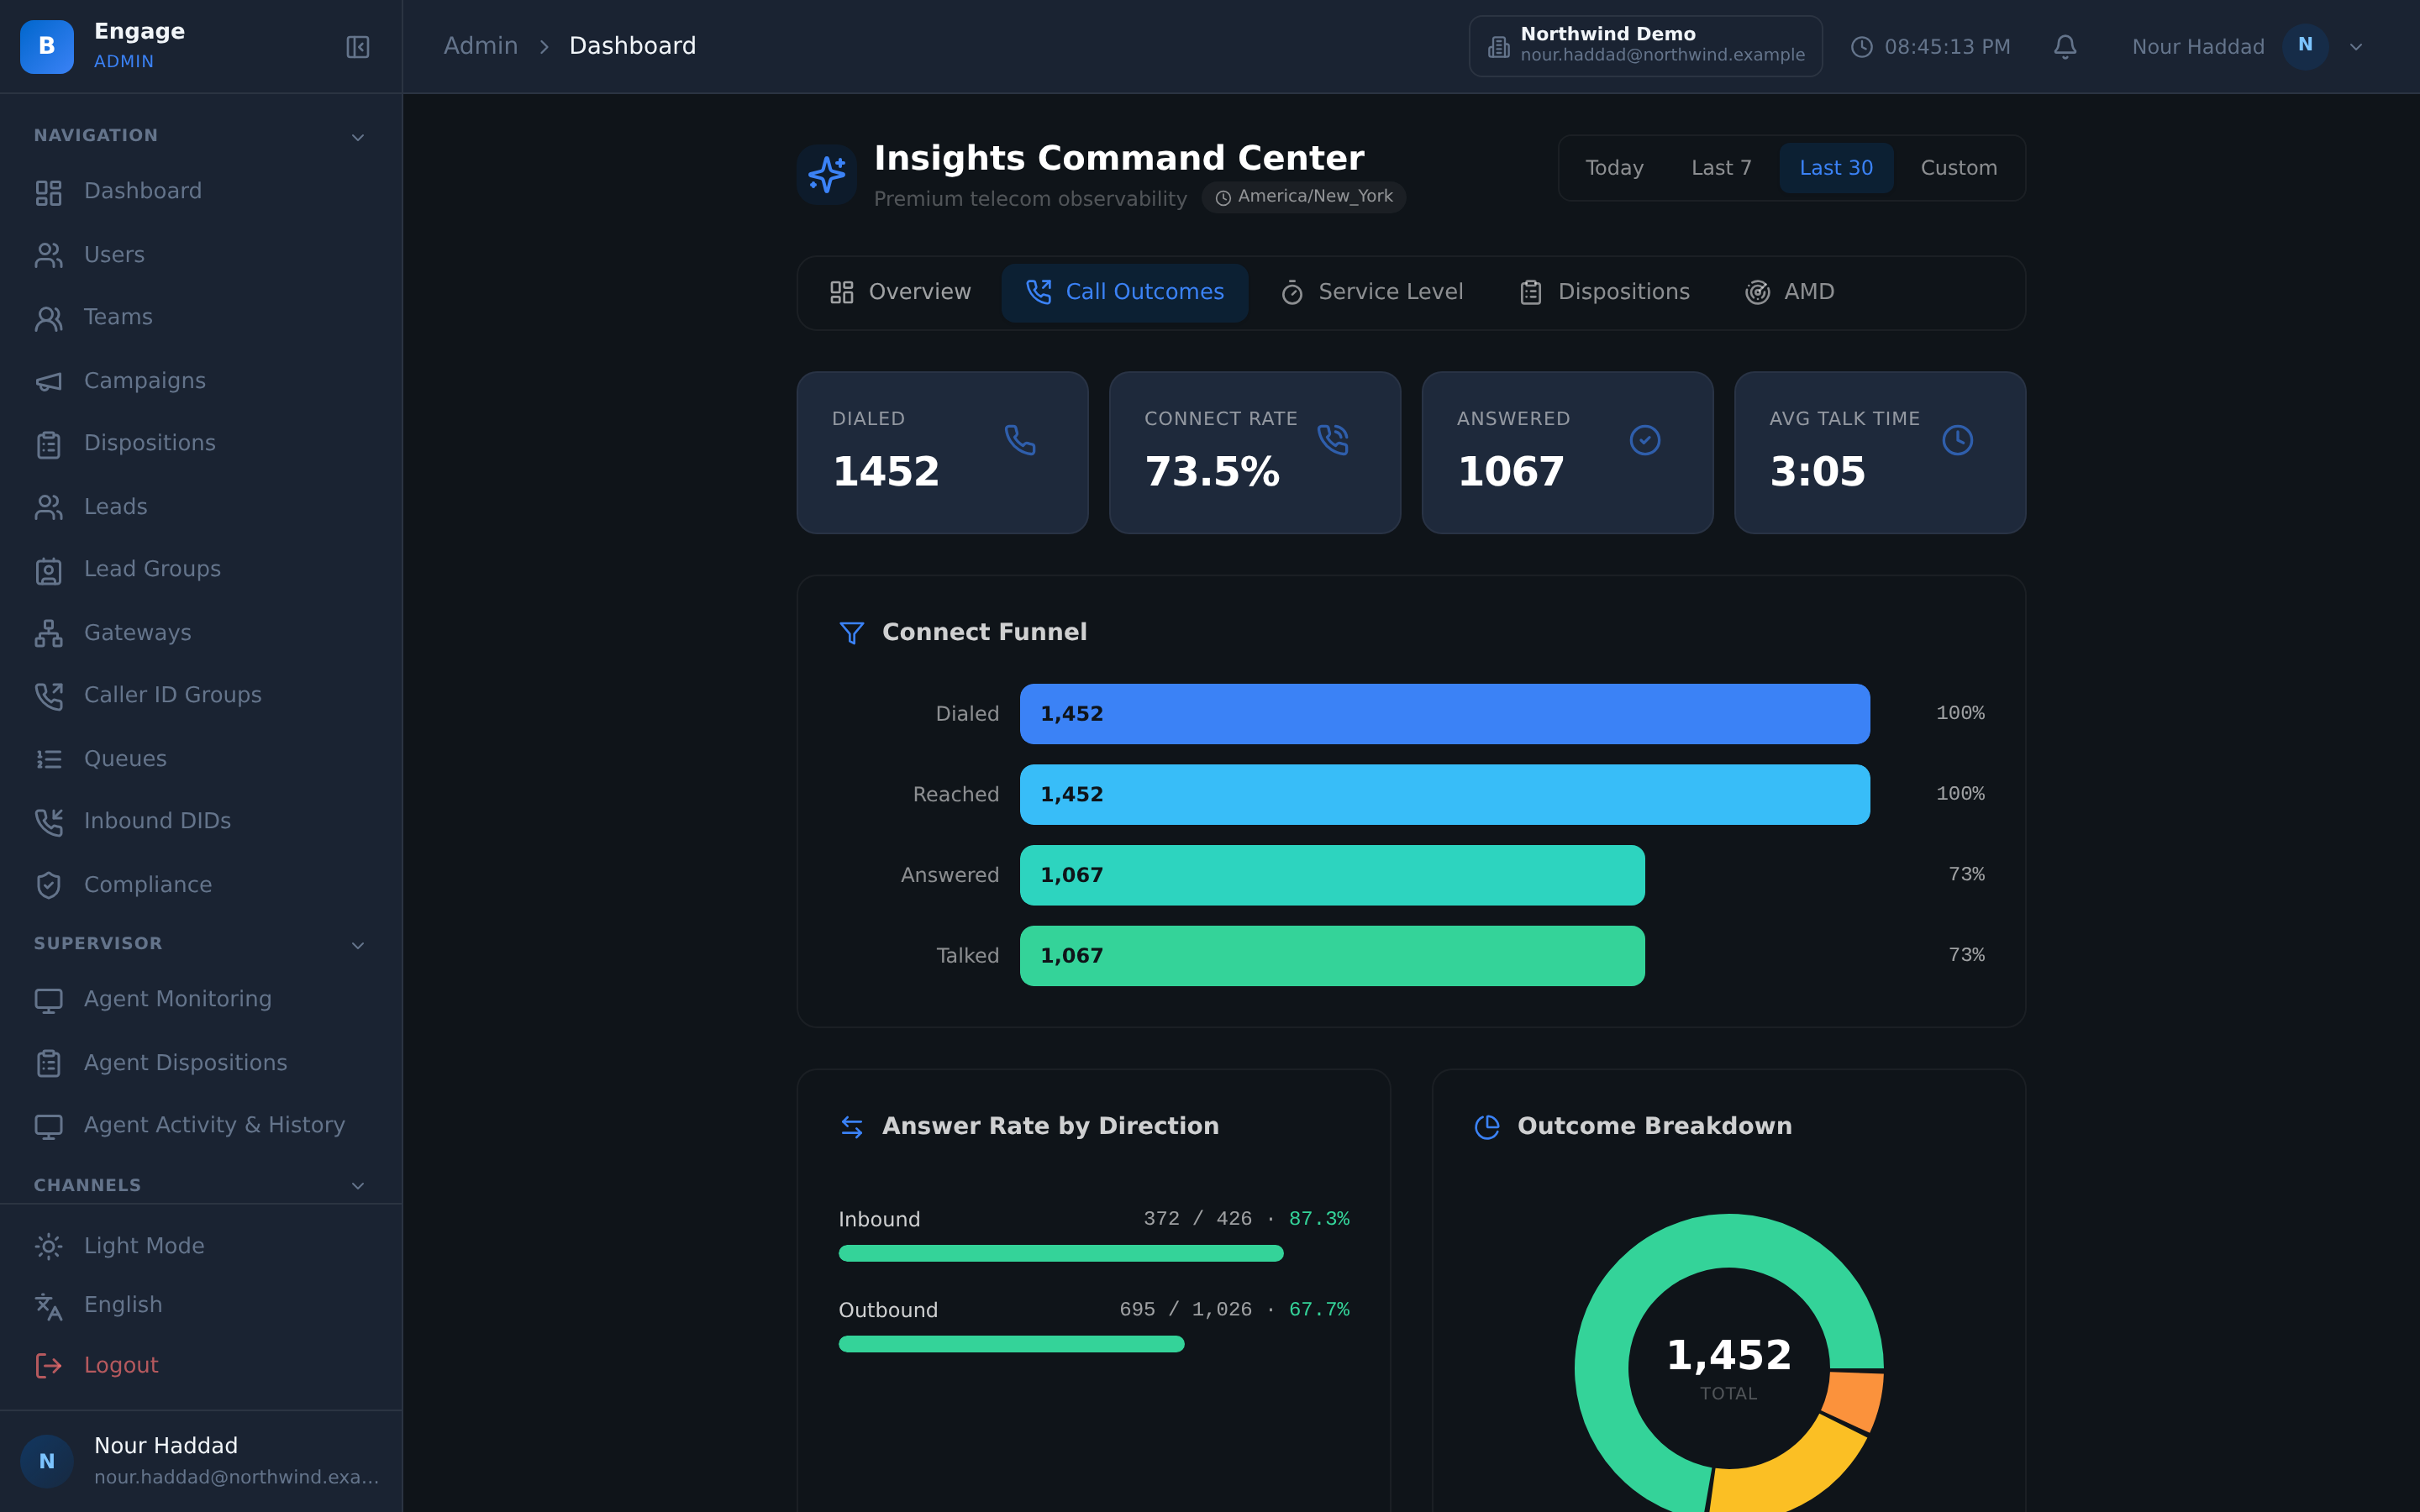
A reporting screen that shows everything answers nothing. The Insights centre splits the same data across four tabs, and each tab exists because someone asks that question every week.
Call Outcomes is what happened to the calls. Service Level is whether the queues held up. Dispositions is what the agents said the calls were. AMD is how the answering-machine detection behaved, which is the one that quietly decides how much of your dialling was wasted.
- Call Outcomes, Service Level, Dispositions and AMD as separate tabs
- The same underlying data as the 15 reports, so the numbers agree
- Disposition reports export to Excel and PDF with Arabic rendered correctly
- Export as CSV, Excel or a PDF carrying your tenant branding
Wallboard
The screen the floor can see
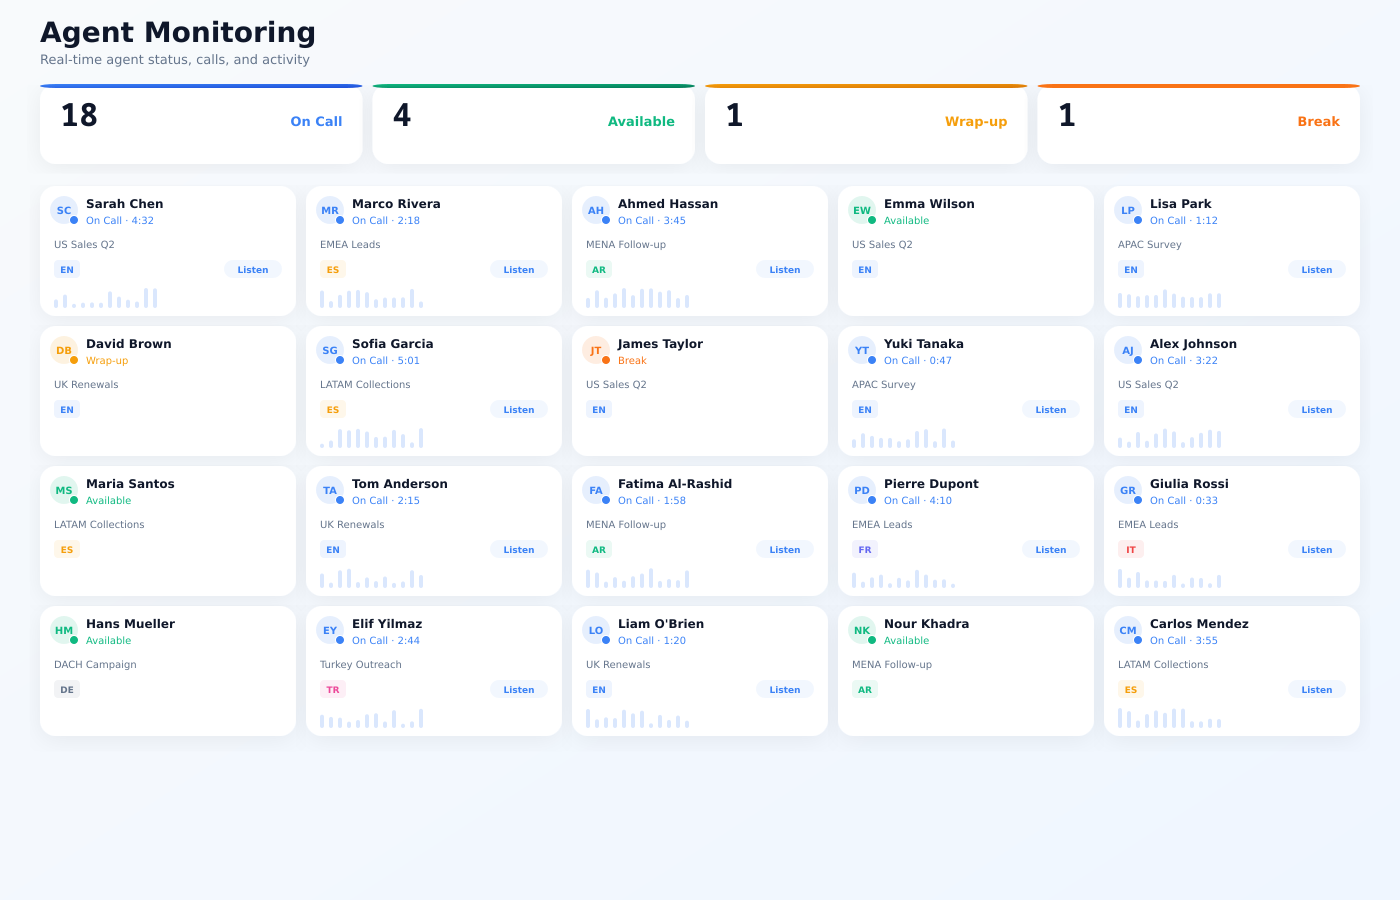
The wallboard carries the live KPIs, an agent state grid, a leaderboard and a MOS card. It is one screen, meant for a monitor on the wall rather than a browser tab a supervisor keeps refreshing.
The MOS card is the part people do not expect. Mean opinion score is captured per call, so when audio degrades the wallboard shows it while the shift is still running, not in tomorrow's report.
- Live KPI cards for the current shift
- Agent state grid showing who is on what, right now
- Leaderboard ranked on the same numbers the reports use
- MOS card, so a call-quality problem is visible during the shift
Agent activity
What they did, with a time on it
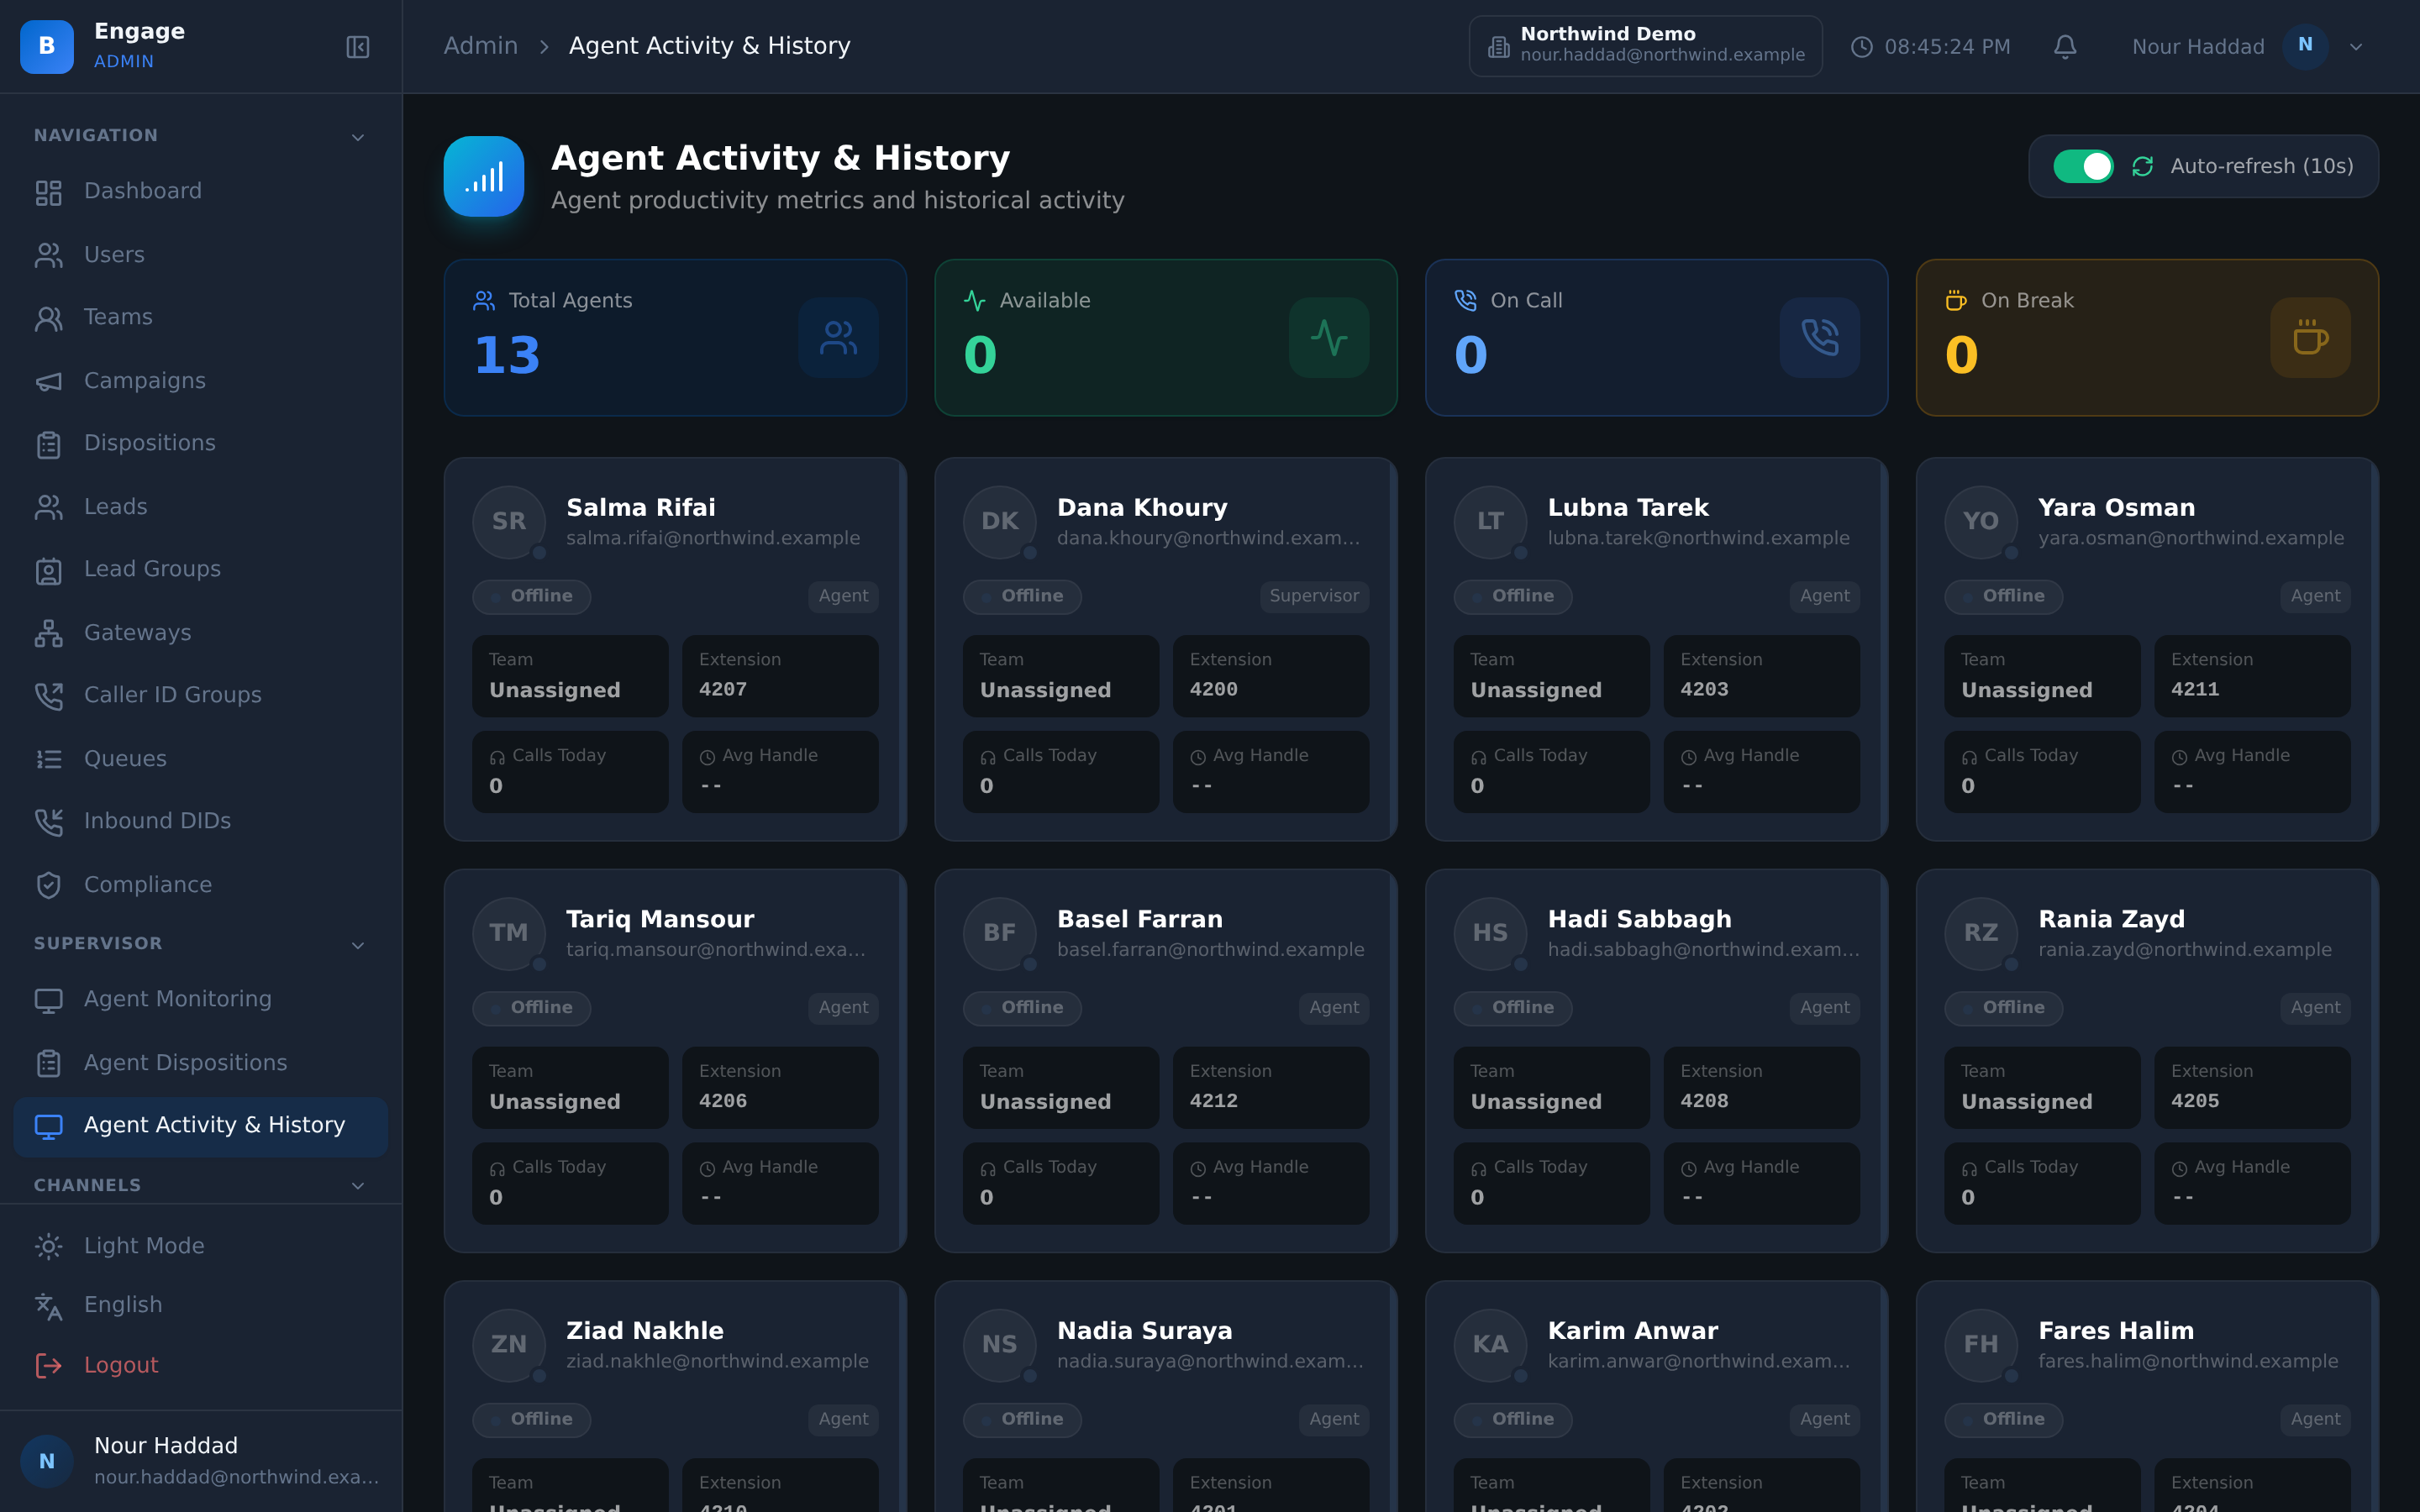
Agent activity history records the states an agent moved through, and live timers show how long they have been in the current one. Beside it sits every disposition that agent set, as a dated event.
That is what turns an Agent Performance number into something you can defend in a review. When someone disputes a figure you open the events behind it rather than re-running the report and hoping.
- Activity history per agent, plus live timers on the current state
- Per-agent disposition events, each with a time
- Agent Performance and Agent Utilization reports built on the same events
- Agent activity and utilisation reports today; forecasting and scheduling are planned
How it compares
| A dialer with a stats tab | DialerBee Reports and Insights | |
|---|---|---|
| Reports | A handful of fixed screens | 15 named report types, listed in full on this page |
| Export | CSV if you are lucky | CSV, Excel and PDF with your tenant branding |
| Arabic | Right-to-left text breaks in the export | Disposition reports export to Excel and PDF with Arabic rendered correctly |
| The floor view | A dashboard someone keeps refreshing | A wallboard with live KPIs, agent state grid, leaderboard and a MOS card |
| Behind an agent number | A total with nothing under it | Activity history, live timers and per-agent disposition events |
| AI calls | Not reported at all | AI call results with recording, transcript and export, plus AI usage and billing |
Frequently asked questions
What is Reports and Insights in DialerBee?+
It is the reporting side of the platform. Fifteen report types cover campaigns, agents, calls, queues, cost, quality, compliance and conversion, each exportable as CSV, Excel or a PDF with your tenant branding. Alongside them sits an Insights centre with Call Outcomes, Service Level, Dispositions and AMD tabs, a wallboard for the floor, and agent activity detail down to individual disposition events.
Which 15 reports are included?+
Campaign Summary, Agent Performance, CDR, Compliance Audit, Cost Analysis, Quality Metrics, Call Recordings, Abandoned Calls, Queue Performance, DNC Compliance, Inbound Calls, Outbound Calls, Agent Utilization, Lead Conversion and Supervisor Overview.
Can I export reports for a client?+
Yes. Every report exports as CSV, as Excel or as a PDF carrying your tenant branding, which is the format most people send on to a client. Disposition reports export to Excel and PDF with Arabic rendered correctly, so a right-to-left report arrives readable rather than as boxes.
What does the wallboard show?+
Live KPIs for the current shift, an agent state grid showing who is on what right now, a leaderboard, and a MOS card. Mean opinion score is captured per call, so audio quality problems appear on the wallboard while the shift is still running.
Does DialerBee do workforce management?+
Agent activity and utilisation reports today; forecasting and scheduling are planned. You can see how agents spent their time and how much of a paid hour went to productive states, but the platform does not build the roster for you.
How do I audit a single agent's numbers?+
Open the agent activity history, which records the states that agent moved through with live timers on the current one, and the per-agent disposition events, each with a time. The Agent Performance and Agent Utilization reports are built from the same events, so the detail and the total agree.
Are AI calls reported the same way as human calls?+
AI call results are recorded with the recording, the transcript and an export, so an AI conversation can be reviewed the way a human one is. AI usage and billing are reported separately, per tenant, which matters if you resell the platform.
Can I see the AMD picture?+
Yes. The Insights centre has an AMD tab covering how answering-machine detection behaved. There is a deeper AMD view in the operations center with recent decisions, labelling, patterns and rollback for the people who tune it.
See the 15 reports run against a demo tenant
A 30-minute walkthrough on a demo tenant, in English or Arabic.